Case Study
By: Hamed Safi
I am thrilled to present a step-by-step process of my design approach for this case study! In this solution, I have integrated predictive analytics and collaboration tools to forecast on-time delivery for retailers and to ensure efficient collaboration in case of any issues. This design exercise demanded a structured approach:
I identified critical stakeholders as retailers, delivery personnel, and customers. I also determined the necessary data for predictive analytics, such as historical delivery times, traffic data, and weather conditions.
To improve delivery processes, it was important to understand how predictive analytics can be utilized. This involved analyzing data to identify patterns and insights that can be used to make predictions about future outcomes. In addition, it was essential to establish a clear communication channel with stakeholders to ensure any issues that arise during the delivery process can be addressed in a timely manner. By combining the power of predictive analytics with effective communication, I can improve the delivery processes and ultimately, provide better service to their customers.
I created a flow demonstrating the process from estimating delivery to resolving issues. Low-fidelity wireframes emphasize functionality, with high-fidelity mockups featuring an intuitive and clean UI design.


In my process I imagined that establishing a communication channel for stakeholders could be achieved through a dedicated platform or app within the solution. This platform could have features like:
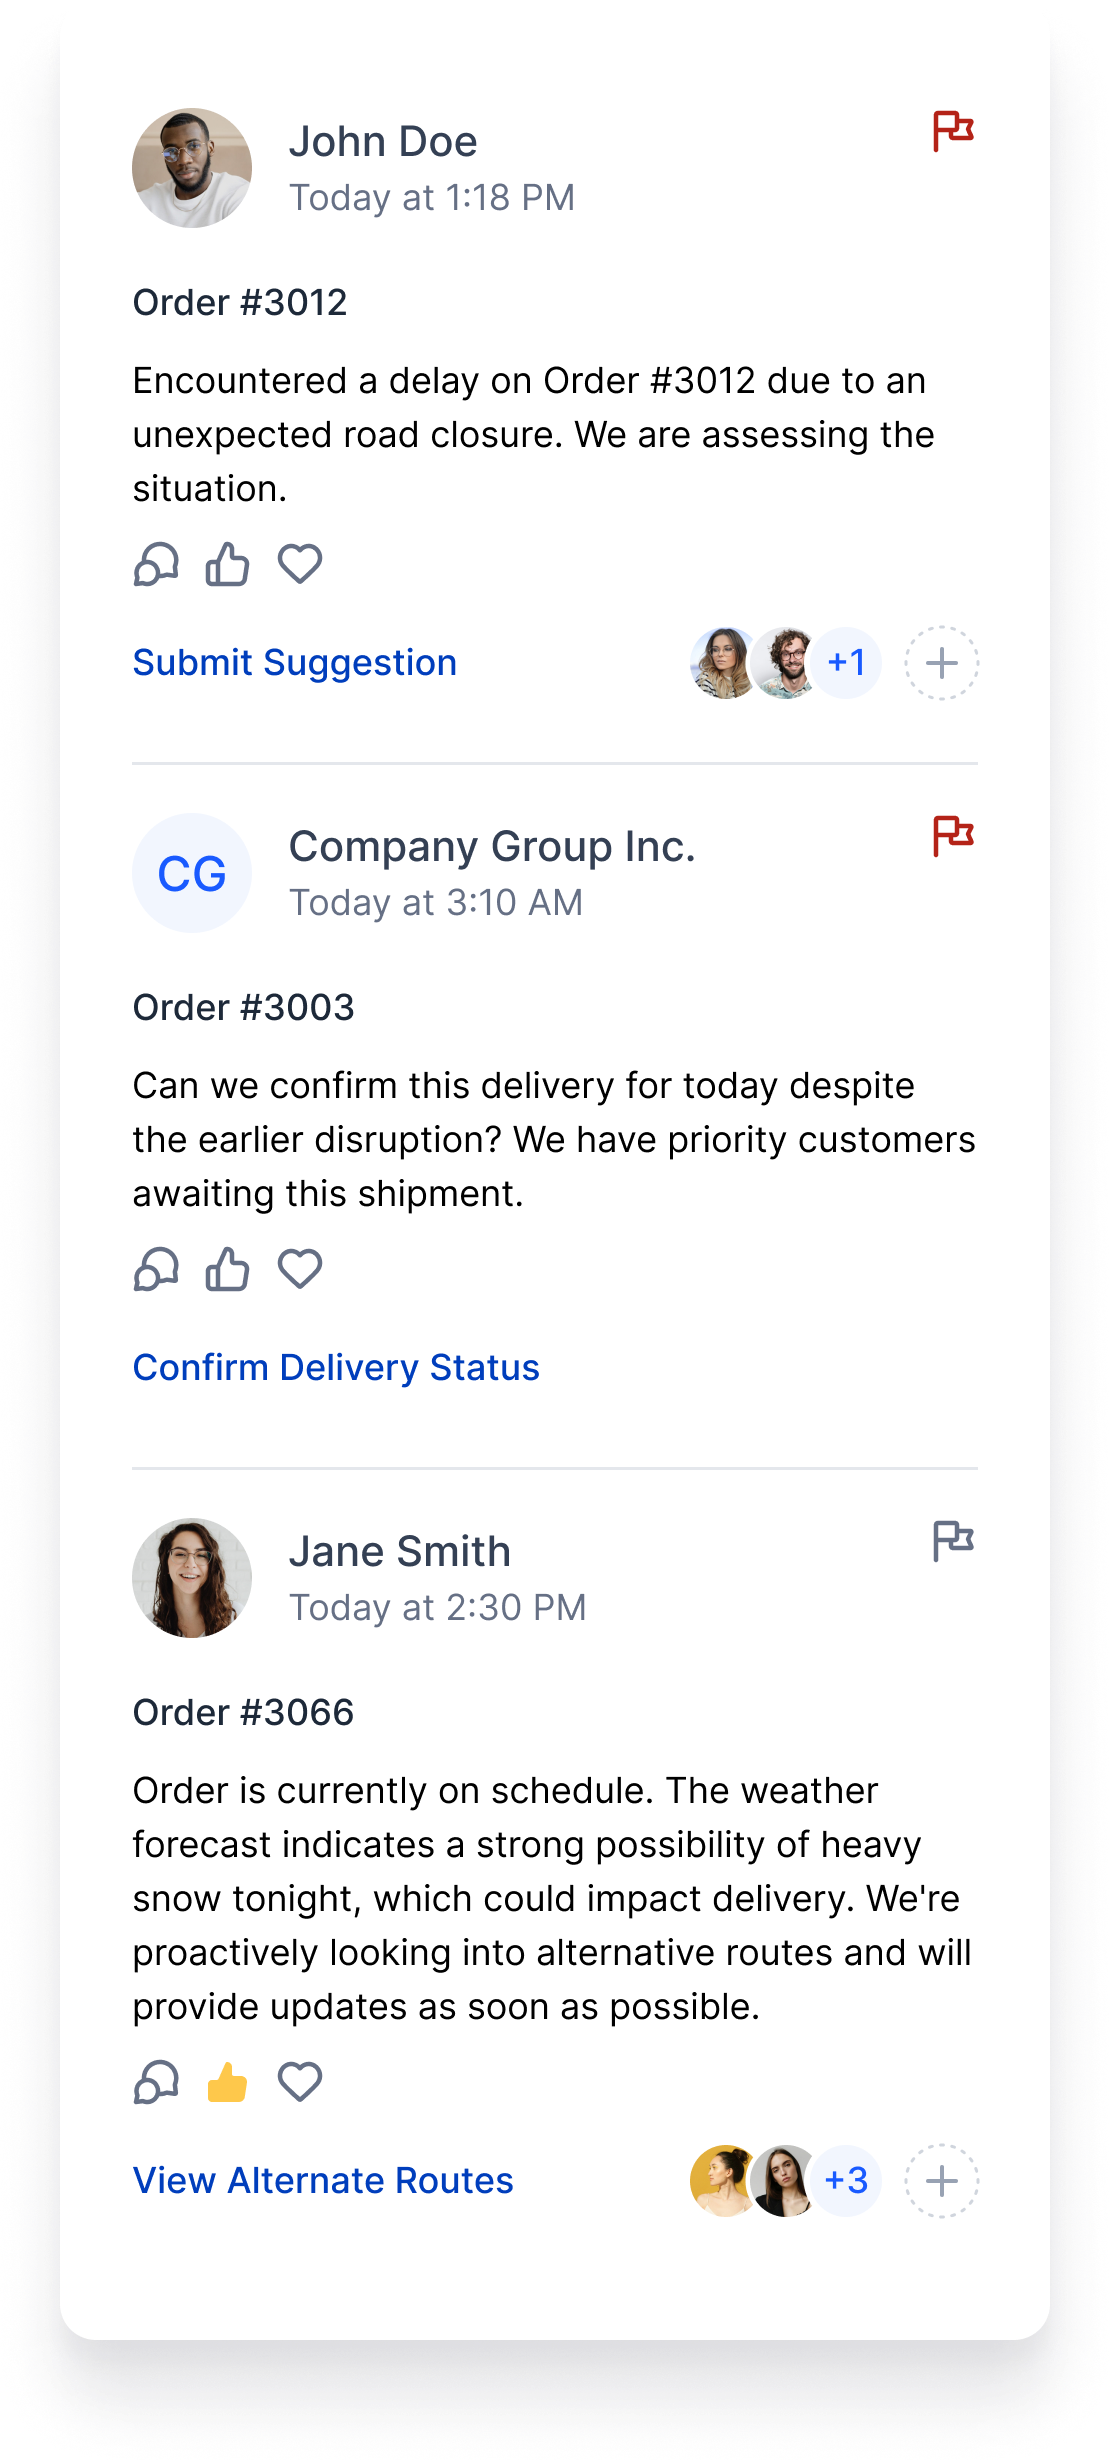
Real-Time Chat: Enable instant messaging between stakeholders to discuss and resolve delivery issues as they arise.
Notification System: Alert stakeholders about potential delays or issues.
Issue Tracking: Allow stakeholders to log, track, and resolve delivery-related issues.
Shared Dashboard: Display real-time data on deliveries, issues, and resolutions.

Performance Snapshot
Delivery Performance Indicator: Shows the current percentage of deliveries made on time, with trend indicators highlighting improvement or decline from the previous period.
Average Delivery Time Gauge: Displays the average time taken for deliveries, with a trend line for quick comparison to past performance.
Open Issues Tracker: Provides a count of current unresolved issues, giving a sense of operational challenges faced.
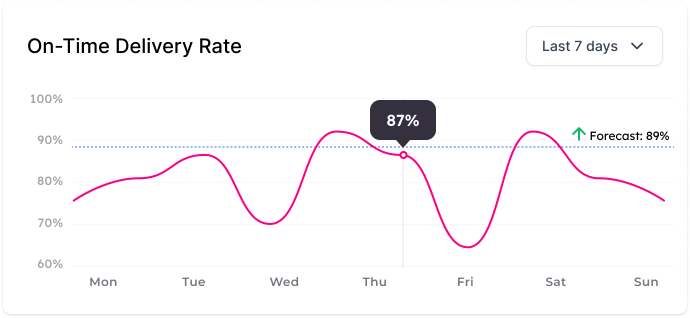
A time-based line graph indicating the percentage of on-time deliveries over the past week, with predictions for the next day to aid in planning.

A time-based line graph indicating the percentage of on-time deliveries over the past week, with predictions for the next day to aid in planning.
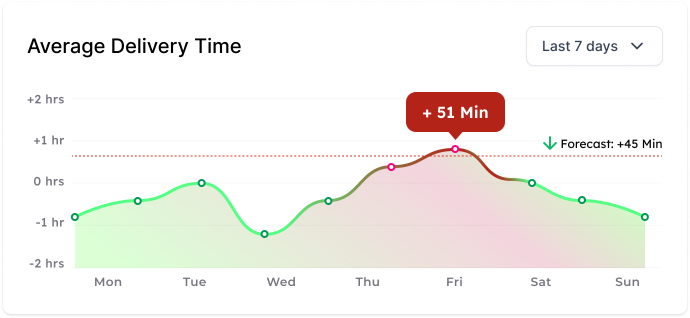
This graph shows the daily average delivery time, allowing for tracking of performance and identifying days with unusual delays.
Notifications: Alerts users to external factors affecting delivery times, prompting proactive measures.
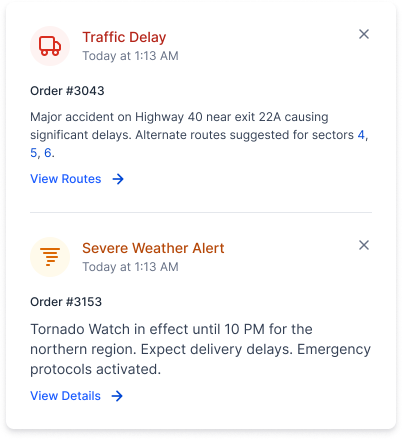

A dynamic feed where staff can post updates, such as traffic or delivery issues, providing real-time situational awareness.
Offers a live geographical view of delivery vehicles, including status updates and alerts for immediate traffic or weather conditions affecting the route.
Cost Per Delivery and Revenue Per Delivery Metrics: Summarizes key financial figures to monitor profitability and operational efficiency.
Savings Indicator: Highlights the financial impact of improvements or investments, like GPS tracking technology.

Provides at-a-glance metrics on operational factors like traffic impact, weather delays, peak order times, and the perfect order rate.

This design focuses on ease of use and efficient information dissemination, ensuring delivery personnel are well-equipped to handle their daily tasks effectively.
Schedule
Displays upcoming delivery details, such as Delivery ID, address, time window, package details, and special instructions.
Provides customer information including name and contact number.
Includes a "Start Route" button for easy navigation to the next delivery location.
Real-time Tracking Map
Shows the current location of the delivery vehicle on the map.
Alerts for any traffic delays with details about the incident, time reported, and expected impact on the route.
Route List
Lists all deliveries with Delivery Number, scheduled time window, destination address, and current status.
Each delivery has a "Start Route" button for route commencement and a progress bar for completed deliveries, with an option to view detailed reports.
Report an Issue
Allows reporting of on-road issues directly through the app with pre-set categories such as Traffic Delay, Vehicle Trouble, and Accident Near Route.
Includes an "Other" option for issues that do not fit the pre-set categories.
Navigation Bar
Quick access to the Home screen, Routes, Issue reporting, Messages, and More options.
This bottom navigation bar ensures that all important features are just a tap away for efficient app navigation.
This customer interface is designed for efficient and informative user experience. It is designed to keep customers informed and in control of their delivery experience.
Delivery Tracking Overview Centralized location for all delivery-related information. Real-time updates and status visibility.
Order Information Order #: Displays the specific order number for user reference. Time: Provides the expected arrival time of the delivery. Address: Confirms the delivery destination for user verification.
Delivery Status Indicates the current progress of the delivery. Visual progress bar and status indicator ("On Track") for at-a-glance updates.
Driver Information and Contact Displays the assigned driver's name and photo for personalized touch. Direct contact option for the driver if needed.
Additional Actions "View Details": Allows users to see more detailed information about their delivery. "Report a Problem": Users can report any issues with their delivery directly through the app.
Support Section: Direct access to help and support features. Links to customer service and frequently asked questions (FAQ).


The proposed solution combines advanced predictive analytics with a robust collaborative interface to provide retailers with an effective tool for predicting on-time deliveries and managing delivery-related issues. Continuous learning from delivery outcomes and customer feedback ensures the system improves over time, offering more accurate predictions and enhancing the customer experience.
Thank you! 🙏
Hamed